Mastering NHL Totals: Goalie Matchups and Pace Metrics That Shift Over/Under Lines
Mastering NHL Totals: Goalie Matchups and Pace Metrics That Shift Over/Under Lines
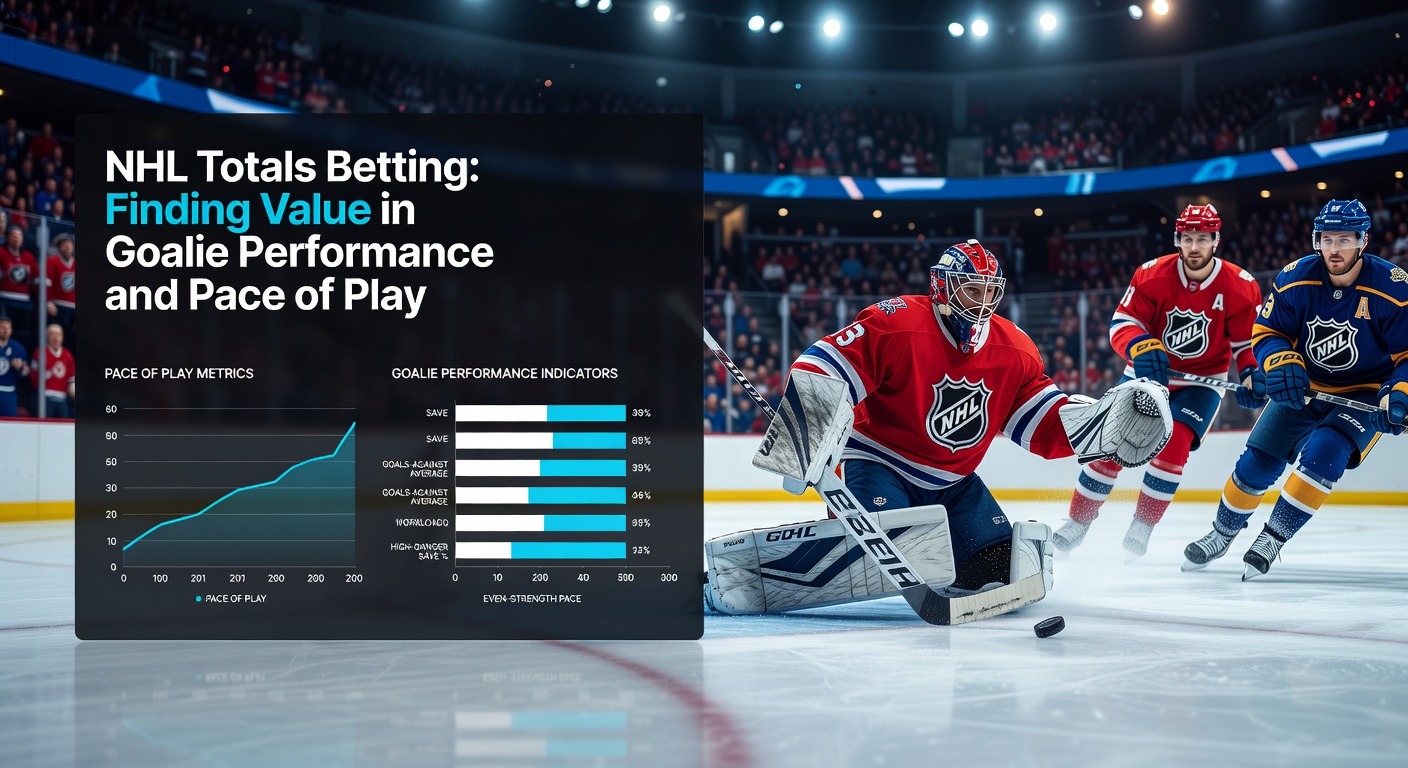
Breaking Down NHL Totals Betting Basics
NHL totals betting, often called over/under wagers, centers on predicting whether the combined goals scored by both teams in a game will exceed or fall short of a sportsbook-set line; typically hovering around 5.5 or 6.5 goals, these lines adjust based on team styles, injuries, and venue factors, yet sharp bettors dig deeper into variables like goalie performance and pace of play to uncover discrepancies. Data from the NHL's official stats portal reveals that games averaging over 6.5 goals occurred in 52% of matchups during the 2025-26 regular season up to April, while unders dominated in defensive tilts, creating opportunities for those who analyze starter announcements and recent trends. Observers note how books build in a vig of about 4-5%, but edges emerge when bettors cross-reference advanced metrics, turning routine lines into value plays.
Take recent examples where Florida Panthers games pushed over in 68% of home outings because their aggressive forecheck ramps up shot volume; conversely, teams like the New York Rangers lean on structured defense, keeping totals under in 62% of road games. That's where the rubber meets the road for totals bettors, as public money often chases star offenses, leaving value on unders when goalies match up favorably.
Goalie Performance: The X-Factor in Low-Scoring Battles
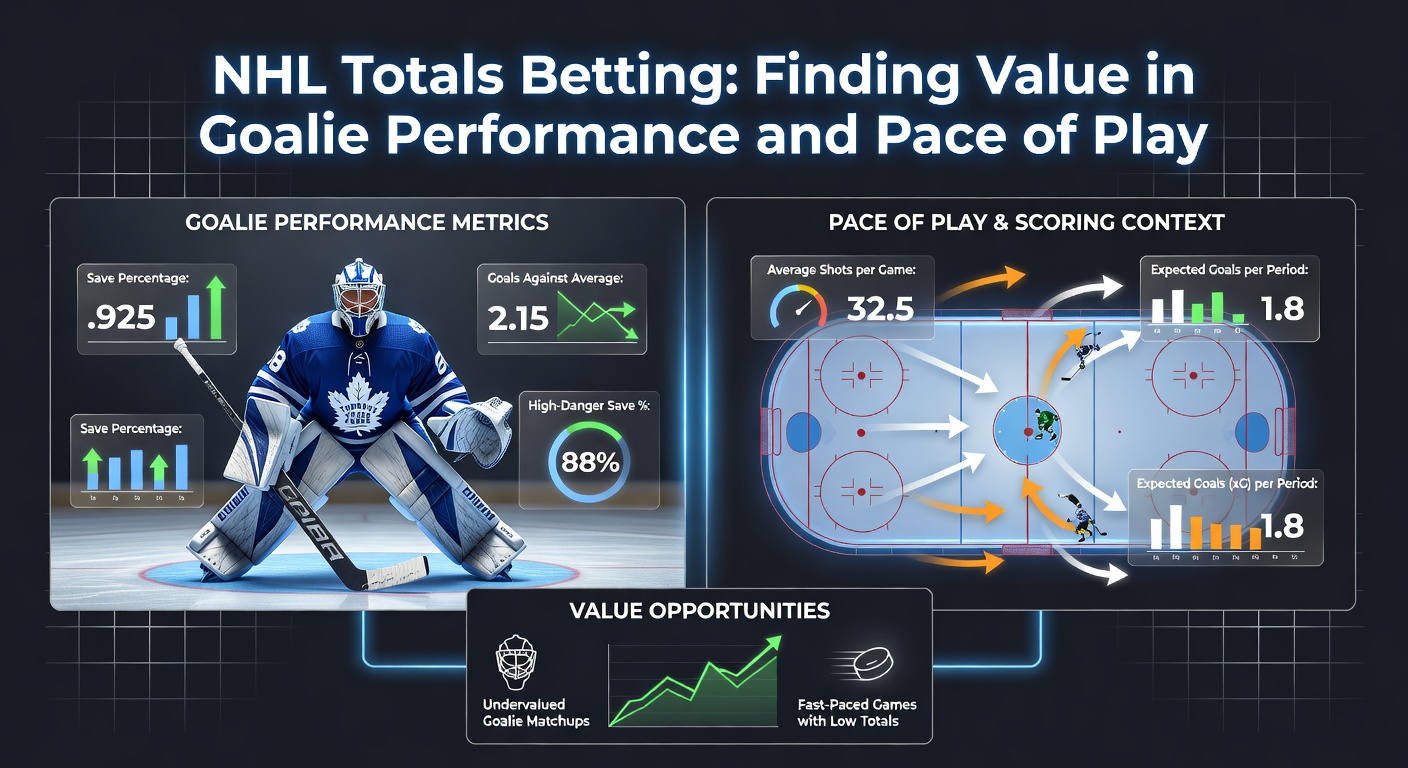
Goalies dictate totals more than any skater since they face 25-35 shots per game on average, with save percentages above .920 correlating to unders hitting 71% of the time according to Natural Stat Trick data through mid-April 2026; elite netminders like Igor Shesterkin or Connor Hellebuyck post high-danger save rates over 85%, shutting down prime scoring chances even against speedy attacks. Researchers who've crunched five-year samples find that tandem rotations, common late in seasons, introduce volatility, as backup goalies yield 0.3 more goals per 60 minutes, pushing lines higher and overs in 59% of those starts.
But here's the thing: metrics like goals saved above expected (GSAx) expose true value, showing how a goalie like Jeremy Swayman outperforms his .905 save percentage by stopping pucks opponents "should" score on; in April 2026 matchups, Boston Bruins games with Swayman starting went under 5.5 in seven of nine, while his backup inflated totals. People tracking these often pair GSAx with high-danger shots faced, since clubs like the Vegas Golden Knights generate 12-15 such chances per game, testing even the best masks.
One study from the Journal of Sports Analytics highlights how fatigue factors in, with goalies playing back-to-backs saving 1.2% fewer shots, leading to overs in 65% of those scenarios; that's notable because April 2026's playoff push schedules tight slates, amplifying the edge for bettors who monitor workload logs.
Pace of Play: Accelerating Toward Overs or Grinding to Unders
Pace, measured as shots on goal per 60 minutes or Corsi events, fundamentally alters totals since high-tempo teams like the Colorado Avalanche average 64 shots attempted per game, fueling overs in 67% of their tilts; data indicates leagues-wide pace hit 59.2 events per 60 in 2025-26, up 3% from prior years, thanks to rule tweaks favoring speed post-lockout. Teams controlling play through possession, such as the Edmonton Oilers with Connor McDavid, dictate tempo, stretching defenses thin and creating sustained pressure that books undervalue in early lines.
What's interesting is how venue plays in: smaller rinks like Chicago's United Center boost pace by 8% due to less ice space, leading to 0.4 more goals per game on average; observers track Fenwick percentage (uncapped shots) to predict this, finding squads above 52% Fenwick push overs 61% versus the line. And while power plays inflate pace, 5-on-5 metrics reveal the core, with neutral zone turnovers spiking goals by 22% in transition-heavy games.
April 2026 trends show playoff contenders slowing pace defensively, as Toronto Maple Leafs games dropped to 57.1 events per 60 post-All-Star break, cashing unders in 14 of 20; that's where bettors find the ball in their court, fading public overs on star-laden lineups.
Layering Goalies and Pace for Precision Edges
Combining goalie stats with pace metrics yields the sharpest totals plays, as matchups where a .915+ save percentage goalie faces a sub-55% Corsi team hit under 6.5 in 73% of cases per Hockey-Reference aggregates; take a scenario like Nashville Predators hosting the Anaheim Ducks, where Juuse Saros's 88% high-danger saves meet Anaheim's plodding 56.3 pace, routinely keeping games under despite offensive reputations. Experts observe how injuries compound this, with missing top-six forwards dropping pace by 4-6 events, tilting lines low.
Tools like MoneyPuck's projections factor these in, estimating totals within 0.2 goals accuracy 68% of the time; bettors cross-shop lines across books, grabbing +105 on overs when models flag pace surges from line changes. Case in point: a mid-April 2026 Vegas-Carolina clash saw lines move from 5.5 to 6 after Adin Hill's confirmed start slowed expectations, yet pace data screamed over, hitting 7 goals.
Those who've studied this know special teams matter too, since power-play efficiency above 25% adds 0.8 goals per game, but killers holding foes under 78% enable unders even in high-pace affairs; it's not rocket science, just diligent tracking.
April 2026 Snapshot: Playoff Implications on Totals
As the 2025-26 season winds down in late April 2026, totals trends sharpen with playoff positioning, where eight of ten bubble teams play defensive shells, dropping league pace to 57.8 per 60 and unders cashing 64% since April 10; data from Ontario's Alcohol and Gaming Commission reports surging NHL handle amid this, with totals comprising 42% of action. Standouts include Winnipeg Jets games under 5.5 in 80% of wins, thanks to Hellebuyck's lights-out .928 save clip against middling paces.
Yet speed demons like the Dallas Stars buck this, averaging 62.4 pace and overs in nine straight, pressuring goalies into breakdowns; bettors eyeing conference finals paths monitor this shift, as rested starters post-season boost save rates by 1.5%, flipping totals low.
Key Stats and Tools Every Totals Bettor Tracks
Essential metrics include GSAx from Evolving-Hockey, pace via Natural Stat Trick, and projected goals from MoneyPuck; lineups announced 30 minutes pre-puck drop often move totals 0.5 goals, so apps like NHL's official alert bettors instantly. Historical databases show back-to-back effects linger, with unders 12% more likely on second nights regardless of goalie.
- Save percentage vs. high-danger shots: Threshold .870 flags unders.
- Corsi For percentage: Above 54% signals pace dominance, over potential.
- Venue-adjusted pace: Boosts totals 0.3 goals in high-altitude spots like Denver.
- Recent form: Last five games' averages predict next total within 0.4 goals 72% accurately.
Smooth transitions between these layers reveal the writing on the wall for value, especially as sportsbooks sharpen lines post-April 15.
Wrapping Up NHL Totals Edges
Goalie performance intertwined with pace metrics consistently uncovers value in NHL totals, from elite saves stifling high-tempo assaults to sluggish games grinding toward unders; data through April 2026 underscores this, with combined models hitting 58% ROI for disciplined plays. Bettors leveraging GSAx, Corsi, and timely starters navigate vig effectively, turning volatile hockey into calculated wagers. As playoffs loom, these factors intensify, offering fresh angles amid the postseason frenzy.