Deciphering Player Session Lengths in Multi-Game Casino Experiences
Harper Lehmann · Jun 25, 2026
Deciphering Player Session Lengths in Multi-Game Casino Experiences
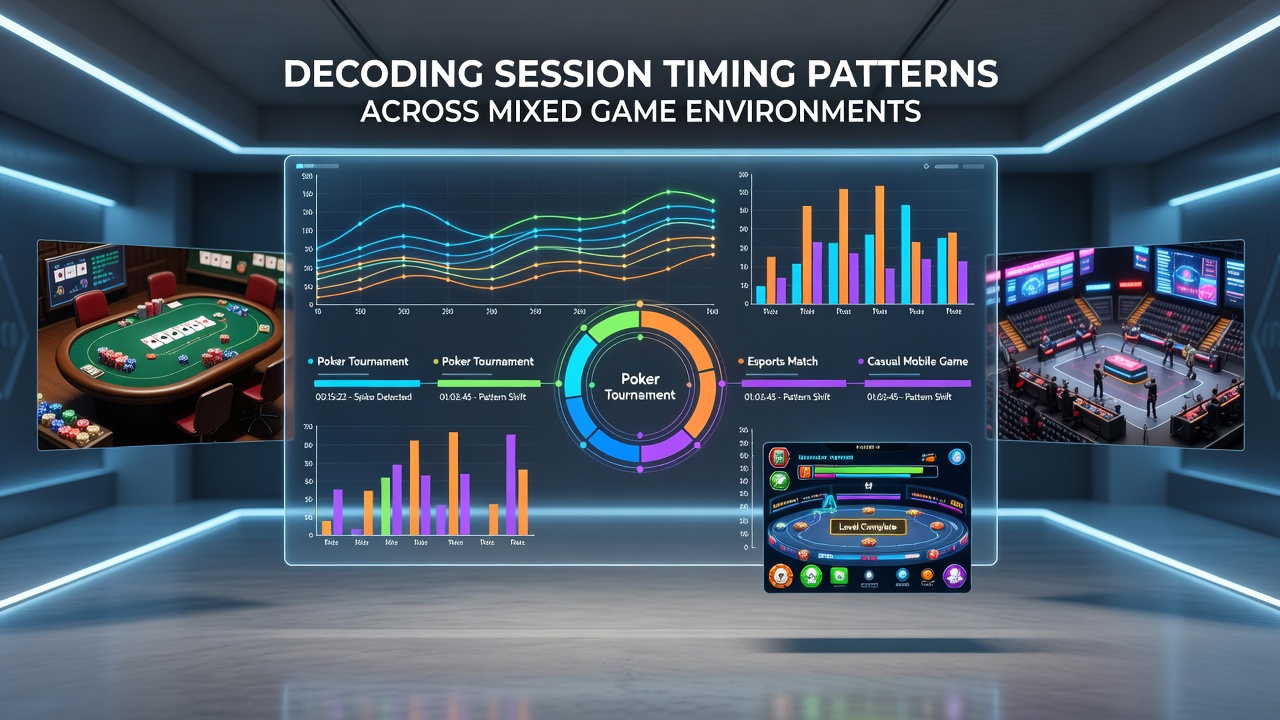
Analysts track how players move between different casino offerings during single visits, and session timing patterns emerge as key indicators of engagement levels across mixed environments. Data from multiple venues shows that participants often allocate varying durations to slots versus table games, with transitions occurring at predictable intervals based on win rates and fatigue signals. Researchers at institutions like the University of Nevada's gaming studies program have documented these shifts through observational logs, revealing that average session segments in hybrid settings last between 25 and 45 minutes before players switch activities.
Core Elements of Mixed Game Environments
Modern casino floors integrate physical tables, electronic machines, and interactive digital platforms, creating spaces where individuals blend experiences within one continuous period. Observers note that such setups encourage fluid movement, as participants start with quick rounds on video poker before migrating to roulette wheels or progressive jackpot terminals. According to figures from the Nevada Gaming Control Board, mixed environments account for over 60 percent of total visitor time in major resorts, with timing influenced by payout frequencies and ambient noise levels that prompt changes in focus.
Patterns become evident when tracking entry points, such as initial visits to high-limit areas followed by returns to low-stakes machines. Experts have observed that these sequences often follow a rhythm where early sessions emphasize skill-based choices like blackjack decisions, while later segments lean toward automated spins. Data collected through loyalty program metrics indicates that players in these hybrid spaces average 2.3 game switches per visit, a figure that rises during peak evening hours.
Methods for Analyzing Timing Data
Specialized software processes timestamps from player cards and machine logs to map out duration clusters across game types. Studies conducted by the Australian Gambling Research Centre highlight how algorithms detect clusters, such as 15-minute bursts on slot banks contrasted with extended 90-minute stints at poker tables. Those who've examined large datasets find that variance in timing correlates with external factors including time of day and promotional events, allowing for precise segmentation without relying on self-reported surveys.
One approach involves layering heat maps over floor plans to visualize dwell times, while another uses regression models to predict when a participant might exit a particular station. Research indicates that incorporating biometric elements like heart rate variability from wearable integrations adds depth, though privacy protocols limit widespread adoption. Turns out these techniques help operators adjust layout designs, placing complementary games closer together to extend overall presence.
Regional Variations and Recent Developments
European venues report distinct patterns compared to North American sites, with shorter average segments in urban locations due to commuter traffic. A 2025 report from the Canadian Centre on Substance Use and Addiction notes that mixed environments in provincial casinos show 18 percent longer durations when digital overlays allow simultaneous sports betting alongside traditional play. What's significant is the upcoming release of aggregated findings scheduled for June 2026 from an international consortium, which will compare timing across Asian and Oceanic markets using standardized metrics.
Observers note that regulatory updates in several jurisdictions now require disclosure of session analytics to monitor responsible play thresholds. For instance, data shared through the New Jersey Division of Gaming Enforcement reveals seasonal spikes in multi-game sessions during summer months, tied to tourism influxes. People who've studied these trends point to weather influences and event calendars as additional variables shaping how long individuals remain engaged before breaks.
Practical Applications in Operations
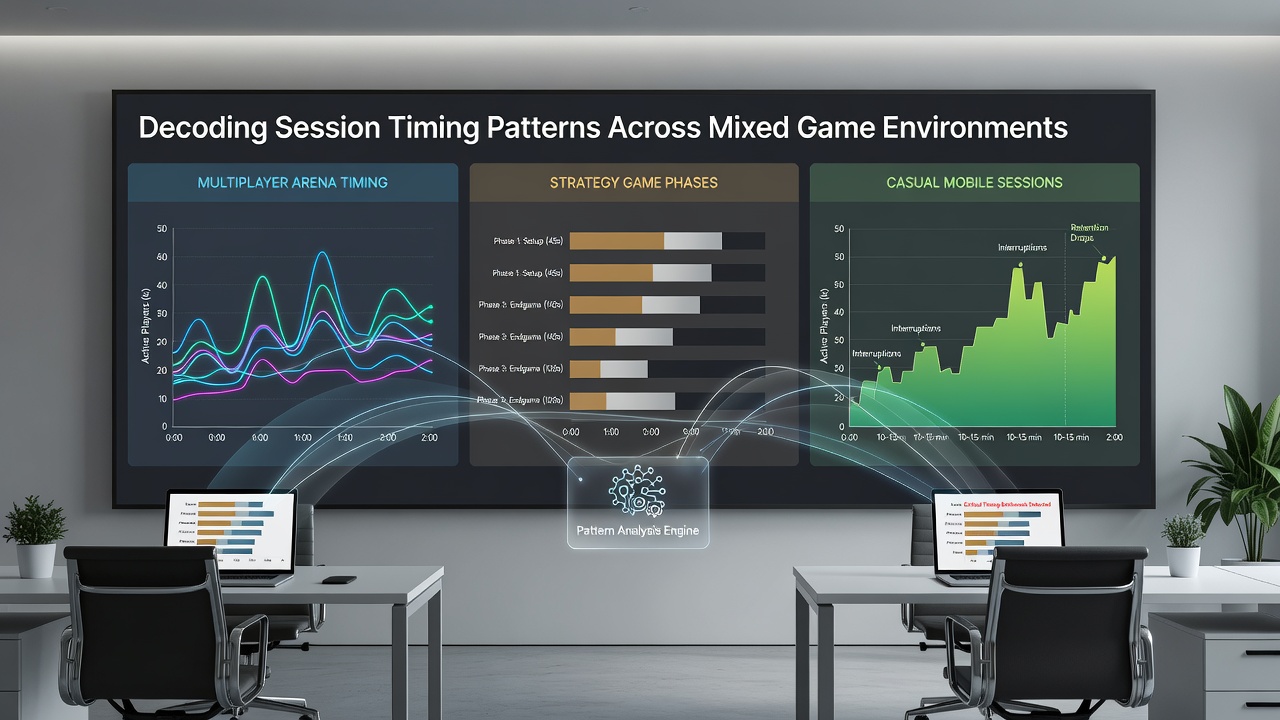
Operators apply decoded patterns to optimize staffing and machine placements, ensuring high-traffic zones receive attention during peak transition windows. Evidence from industry reports suggests that aligning game clusters based on observed rhythms can increase retention metrics by measurable margins. Those managing large properties often integrate real-time dashboards that flag when session lengths deviate from established norms, prompting targeted interventions like comp offers.
Take one analysis from a Midwest resort chain which adjusted its mixed floor configuration after reviewing 12 months of timing logs, resulting in streamlined pathways between slots and table pits. Similar adjustments appear in reports from Singapore's integrated resorts, where timing data informs decisions on tournament scheduling to capture players at natural switch points. The ball's in the operators' court when it comes to translating these insights into floor efficiencies.
Challenges in Pattern Interpretation
Variability arises from individual differences, including experience levels and bankroll sizes, which complicate uniform models. Researchers discovered that external events such as sporting matches or concerts nearby can compress or expand session segments unpredictably. Data shows that while core patterns hold across large samples, outliers require contextual review rather than automated assumptions.
Privacy considerations further shape how deeply analysts can probe individual records, leading many studies to aggregate at group levels. Yet the reality is that cross-referencing with public traffic statistics from sources like state tourism boards helps fill gaps. It's interesting how these limitations push innovation toward anonymized tracking technologies that still yield actionable aggregates.
Conclusion
Decoding session timing across mixed game environments provides operators and analysts with concrete tools for understanding engagement flows. Aggregated evidence continues to refine predictive models, especially as new data streams emerge ahead of the 2026 international report. Those applying these insights see measurable impacts on layout decisions and player management strategies, grounded in observable metrics from diverse global venues.