Bankroll Allocation Patterns Across Mixed Casino and Sports Environments
Harper Lehmann · Jul 9, 2026

Bankroll Allocation Patterns Across Mixed Casino and Sports Environments
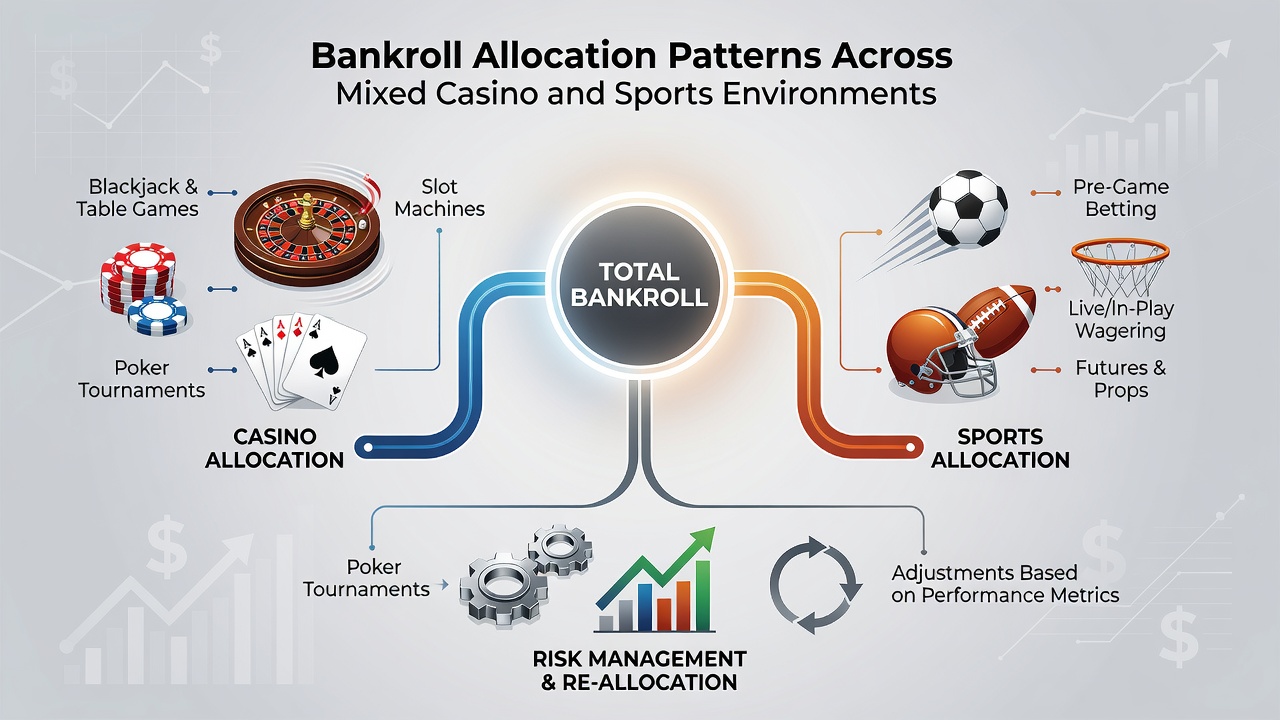
Bankroll allocation in environments that combine casino games with sports betting requires structured division of funds based on variance levels, session lengths, and outcome probabilities that differ sharply between the two formats. Data from multiple industry analyses shows participants often split resources according to observed risk profiles, where sports wagers tend toward lower per-event volatility compared to many table games yet demand larger sample sizes for statistical edges to emerge.
Observed Division Ratios in Practice
Research compiled across operator platforms indicates common splits range from 55 percent sports and 45 percent casino to 70 percent sports and 30 percent casino, with adjustments made when live event calendars overlap with high-traffic casino promotions. Those who track results over extended periods report that allocations shift seasonally because major tournaments increase sports volume while holiday periods drive casino floor traffic higher.
Key Factors Influencing Allocation Decisions
Experts have observed that bettors calculate exposure by matching bankroll segments to the mathematical properties of each activity. Casino sessions often feature house edges that remain constant across repeated plays, whereas sports markets allow odds adjustments based on line movement and public betting trends. This difference leads many to reserve larger portions for sports during weeks when multiple leagues run concurrently, since correlated outcomes across events can compound variance in ways single-table sessions rarely match.
Session-Based Adjustments
Patterns emerge when participants set per-session limits that reflect game speed. A typical casino session lasts under two hours with rapid decisions, prompting smaller per-session allocations, while sports betting spans hours or days per event, allowing larger committed amounts per wager without exhausting daily limits. Figures from tracking software used by frequent participants reveal average sports allocations per event sit between 1 and 3 percent of total bankroll, whereas casino buy-ins often stay under 2 percent to accommodate multiple table switches within one visit.
Regional Variations in Allocation Trends
Reports issued by the Nevada Gaming Control Board document higher casino allocations among visitors who travel specifically for table games, whereas local participants in the same jurisdiction allocate more heavily toward sports during football season. Similar contrasts appear in Australian data from state regulators, where online sports markets receive larger shares during international cricket and rugby windows compared to electronic gaming machine play.
European markets tracked by the Malta Gaming Authority show parallel behavior, with live sports betting drawing increased shares when football leagues overlap with major tennis tournaments. Observers note these patterns hold across both online and land-based settings because the underlying probabilities and payout structures remain consistent regardless of delivery channel.
Tools and Tracking Methods
Software platforms that aggregate activity across both verticals allow users to monitor allocation ratios in real time. These systems flag deviations when one category exceeds preset thresholds, prompting rebalancing before variance clusters erode the overall reserve. Industry reports from the American Gaming Association highlight that operators incorporating such tools observe steadier play volumes because participants maintain clearer separation between casino and sports segments.
Academic studies published through university gambling research centers further indicate that structured allocation correlates with longer participation spans before reserves reach depletion points. The studies compare cohorts using fixed-percentage models against those adjusting dynamically based on recent results, finding measurable differences in duration of activity across mixed environments.
Conclusion
Allocation patterns across mixed casino and sports settings reflect measurable differences in game mathematics, session duration, and regional calendars. Data from regulatory bodies and research institutions continues to document consistent ratios and adjustment behaviors that participants apply when both formats operate within the same bankroll framework. These patterns remain observable through operator analytics and independent tracking systems well into 2026.